Data Analyst Portfolio: 3 Project Templates That Get Hired

A hire-ready data analyst portfolio consists of a curated selection of end-to-end project pages, each with a one-line business summary, a reproducible code link on GitHub, at least one clear visualization, and a measurable recommendation. That is what recruiters expect to see, and career guides consistently recommend a curated selection rather than an exhaustive list of every assignment you have ever touched.
Here is the quick checklist before you publish:
- Hero project: one flagship case study with a full end-to-end narrative
- 1–2 supporting projects: different domains or tools to show range
- About page: two to three sentences on your background and the roles you are targeting
- Resume link: a downloadable PDF, visible on every page
- Contact method: email or a form, above the fold
- Code repo links: GitHub for every project, with a README in each
Your immediate next step: pick one project you have already done, write a one-page case study around it, and publish it within 48–72 hours. Use Myseera to convert your CV into a live site in minutes, or push a static page to GitHub Pages today. Speed matters more than perfection at this stage.
Pro Tip: Name your portfolio projects after the business question they answer, not the technique you used. “Reducing Churn for a SaaS Subscription Business” lands better with a recruiter than “Logistic Regression Model.”
Where this guidance comes from: the structure and red flags below reflect what we see building portfolios at Seera plus widely-shared career-guide advice (see sources at the end). Specific figures inside example project pages — churn percentages, retention drops, recovery estimates — are illustrative sample outputs to show the shape of a good result, not measured data; label your own numbers as estimates the same way when they come from simulated or partial datasets.
Table of Contents
- What structure does every recruiter expect on a project page?
- High-impact project ideas for early-career analysts
- How should you present code and notebooks without losing recruiters?
- How do you structure a project page so recruiters read deeper?
- Where should you host your portfolio, and which platform is fastest?
- How long does it take to build a portfolio, and what does it cost?
- What should you fix before sending your portfolio to recruiters?
- A fill-in-the-blanks project page template you can use today
- [Project Name]
- Key Takeaways
- Why curated, outcome-focused projects beat code dumps every time
- Your fastest path from CV to live data analyst portfolio
What structure does every recruiter expect on a project page?
Recruiters expect an end-to-end narrative that moves from problem to recommendation without gaps. The structure below is the standard layout used in job-ready portfolios, and skipping any section signals an incomplete thought process.
1. One-line business summary + executive summary Open with a single sentence that states the outcome: “Identified three customer segments driving 68% of churn, enabling a targeted retention campaign.” Follow with two to three sentences that describe the stakeholder, the data, and the result. This is what a hiring manager reads in the first 30 seconds.
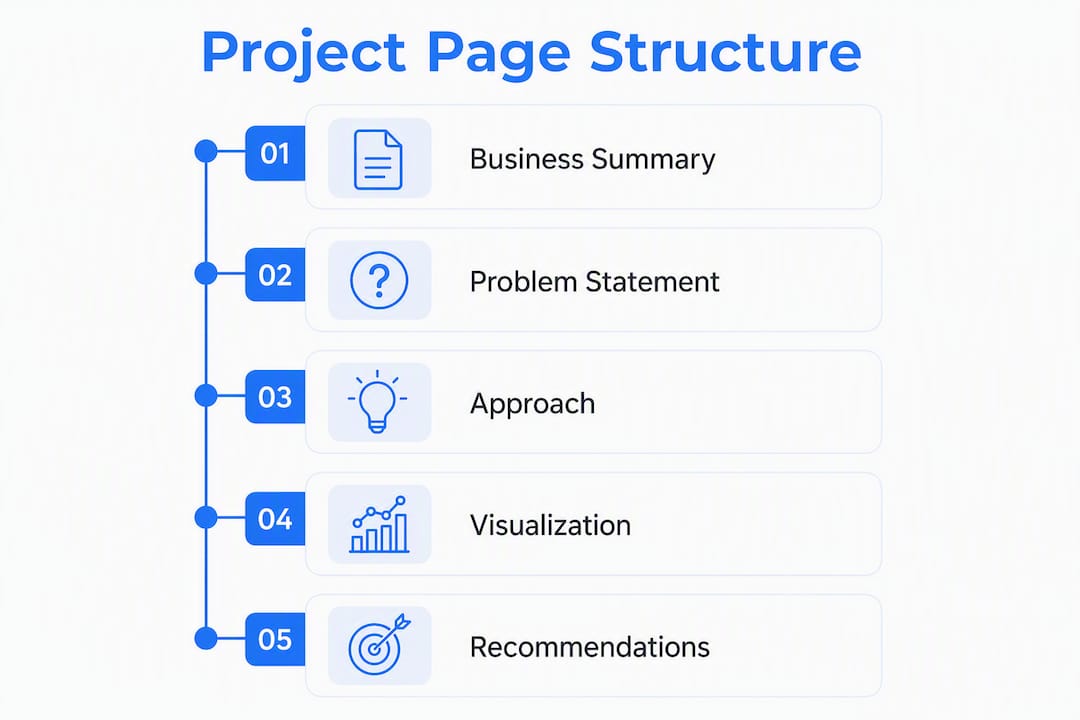
2. Problem statement Define the stakeholder question and the success metric. “The marketing team needed to understand why trial users were not converting, measured by 30-day conversion rate.” Specificity here signals that you understand how analytics work in a business context, not just in a notebook.
3. Data sources Describe where the data came from, how you accessed it, its approximate size, and any schema issues: missing fields, ambiguous joins, or inconsistent date formats. A sentence on data limitations shows professional judgment.
4. Cleaning and transformation Highlight the non-obvious steps. Anyone can drop nulls; show that you made deliberate decisions about imputation, outlier treatment, or feature engineering. Then add a short “Challenges & Tradeoffs” note.
Including a ‘Challenges & Tradeoffs’ section moves the conversation beyond code to production-level thinking. Explain missing data handling, performance vs. complexity choices, and stakeholder assumptions — this is what separates a junior analyst from someone ready to work on real pipelines.
5. Analysis Show the core approach with a small, linked code excerpt or notebook snippet. A five-line SQL CTE or a Pandas groupby with a window function is enough to prove technical fluency. Link to the full notebook in GitHub for reviewers who want to go deeper.
6. Visualization and delivery Place the most relevant chart up front and caption it with one sentence tied to business action: “Cohort retention drops 22 points between weeks 2 and 3, suggesting the onboarding flow is the primary friction point.” That sentence is more persuasive than the chart alone.
7. Recommendations Close with one to two concrete next steps and a measurable impact estimate. “Redesigning the week-2 onboarding email sequence could recover an estimated 8–12% of churned trials based on cohort data.” Simulated KPIs are fine for early-career portfolios; label them as estimates.
Pro Tip: Write the executive summary last. Once you have completed the full analysis, you will know which finding is actually worth leading with.
High-impact project ideas for early-career analysts
The best data analyst projects use messy, real-world data rather than pre-cleaned Kaggle datasets. Employers value the ability to clean and contextualize raw data as evidence of practical competence. Below are eight project ideas, each with a dataset source, primary tools, and a note on hireability.
-
SaaS churn analysis: Use a public subscription dataset from Kaggle or a synthetic CRM export. Tools: SQL + Python (Pandas, scikit-learn). Why it helps: churn is a universal business problem; showing you can define, measure, and explain it signals product analytics readiness.
-
E-commerce conversion funnel: Google Merchandise Store data via Google Analytics 4 demo account. Tools: SQL + Looker Studio. Why it helps: funnel analysis is the most common BI interview question in e-commerce and retail roles.
-
A/B test analysis: Udacity’s A/B testing dataset or a synthetic experiment. Tools: Python (SciPy, Seaborn). Why it helps: demonstrates statistical thinking, which separates analytics candidates from pure reporting roles.
-
Sales territory performance: Open sales data from Salesforce Trailhead or a public CRM dataset. Tools: SQL + Tableau. Why it helps: maps directly to revenue operations and sales analytics job descriptions.
-
Cohort retention analysis: Any subscription or app-usage dataset with a user ID and event date. Tools: SQL (window functions) + Python. Why it helps: cohort analysis appears in nearly every product analytics take-home test.
-
Healthcare claims analysis: CMS Medicare public use files. Tools: Python + Power BI. Why it helps: healthcare is one of the largest analytics hiring markets in the US, and public CMS data is genuinely messy.
-
Public transit ridership trends: US city open data portals (NYC MTA, Chicago CTA). Tools: Python + Tableau. Why it helps: demonstrates working with time-series data and government APIs, relevant for operations and civic analytics roles.
-
Job market analysis: Scrape or download LinkedIn/Indeed job postings via a public dataset on Kaggle. Tools: Python (NLTK, Pandas) + Tableau. Why it helps: meta-relevance — you are analyzing the market you are entering, which makes for a compelling narrative.
For analytics roles, emphasize SQL and dashboard delivery. For BI roles, lead with Tableau or Power BI output. For operations roles, focus on process metrics and cost impact.
How should you present code and notebooks without losing recruiters?
The goal is to make your work easy to validate without forcing a reviewer to run your entire pipeline. Practitioners avoid raw notebook dumps by creating narrative project pages that surface a key code excerpt, then link to a well-organized GitHub repo.
README structure (keep it under one page):
- Goal: one sentence on what the project answers
- Files: a short folder map (data/, notebooks/, outputs/)
- Reproduce: 1–3 commands to install dependencies and run the analysis
- Data notes: source link, license, and whether you used raw or synthetic data
On the project page itself, include one focused snippet: a SQL CTE, a Pandas transform, or a key model call. Five to fifteen lines is the right length. The full notebook lives in GitHub; the page shows that you can communicate code, not just write it.
Small reproducible examples and environment files make it possible for a reviewer to validate your key transform without running a full pipeline. Include a requirements.txt or environment.yml, a reproducible random seed, and a small sample dataset or schema description.
For privacy and NDA situations: use synthetic data generated with Faker or a public schema that mirrors your real data structure. Never share client data; document the substitution clearly in your README.
Pro Tip: Pin your best repository to the top of your GitHub profile. Recruiters who click through from your portfolio page will land on your profile — make the first impression count.
How do you structure a project page so recruiters read deeper?
Hiring managers often scan portfolios in under a minute, so the visual hierarchy of your page determines whether they keep reading. Surface the most important visualization and business insight above the fold.
Hero area: one-line outcome, one-sentence impact, and a thumbnail chart or KPI callout. Think of it as a billboard: if a recruiter sees nothing else, they should still understand what you did and why it mattered.

Use progressive disclosure after the hero. A short executive summary sits at the top; Methods, Code, and Appendices can live in expandable sections or clearly separated blocks below. This keeps the page clean for non-technical reviewers while giving technical interviewers a path to the details.
Chart type guide:
| Analytical finding | Recommended chart type | When to use it |
|---|---|---|
| Trend over time | Line chart | Monthly KPIs, cohort curves, time-series |
| Distribution | Histogram or box plot | Score distributions, outlier detection |
| Relationship | Scatter plot | Correlation, regression diagnostics |
| Composition | Stacked bar or treemap | Segment breakdowns, budget allocation |
| Comparison | Bar chart (sorted) | Ranking regions, products, or cohorts |
Copy rules: keep paragraphs to two to three sentences on the project page. Use callout boxes for assumptions and tradeoffs so they stand out visually without interrupting the narrative flow.
If the project involved collaboration, add a brief role matrix: “I owned data cleaning and visualization; the product manager defined success metrics.” This demonstrates soft skills without a separate section.
Pro Tip: Export your key chart as a PNG at 1200px wide and compress it with Squoosh before uploading. Fast-loading visuals signal production awareness and keep mobile readers engaged.
Where should you host your portfolio, and which platform is fastest?
Content quality outweighs platform choice, but your hosting decision affects load speed, recruiter perception, and how quickly you can publish. Here is a direct comparison:

| Platform | Setup time | Maintenance | Customization | Best for |
|---|---|---|---|---|
| Custom domain + React/Tailwind | 4–8 hours | High | Full | Developers comfortable with code |
| GitHub Pages | 30 min | Low | Moderate | Analysts who want free, code-linked hosting |
| Vercel | 15–30 min | Very low | Moderate | Fast static deploys from a GitHub repo |
| Canva | 15–20 min | Very low | Limited | Quick visual-first pages with no coding |
| Myseera | Under 5 min | Very low | High (templates + inline editor) | Fastest CV-to-live-portfolio path |
Lean, fast-loading portfolios signal production readiness to technical reviewers. Whatever platform you choose, run a Google PageSpeed check before sharing with recruiters.
Publishing checklist:
- Page title includes your name and role (e.g., “Jane Smith | Data Analyst Portfolio”)
- Meta description mentions your top two tools and the type of analysis you do
- Resume PDF is linked from the nav or hero area
- Contact email or form is visible without scrolling
- Each project page has a canonical URL (no trailing slashes or duplicate paths)
- robots.txt is not blocking your pages
Myseera’s AI-powered builder handles the fastest path: upload your CV, confirm the extracted projects, pick a case-study template, add your GitHub links, and publish live. Custom domains and built-in analytics are available on the Pro plan, which is worth considering once you start tracking recruiter visits.
Pro Tip: Add your portfolio URL to your LinkedIn headline and your email signature the day you publish. Recruiters who find you on LinkedIn will click through before they ever see your resume.
How long does it take to build a portfolio, and what does it cost?
A publishable first project takes 48–72 hours of focused work. A polished three-project portfolio with a clean About page and working code links typically takes two to six weeks, depending on how much time you can dedicate each week.
| Milestone | Timeline | Deliverable |
|---|---|---|
| Choose project + draft outline | Days 1–3 | Problem statement + data identified |
| Publish first project page | End of week 1 | Live URL with hero area + one visualization |
| Complete two more projects | Weeks 2–4 | Three total project pages + README files |
| Polish + apply | Week 4 onward | Final QA, resume updated, applications sent |
Typical costs:
- Free: — GitHub Pages, Myseera free tier, Google Colab for notebooks, Looker Studio for dashboards
For a detailed cost breakdown, portfolio website pricing covers domain, hosting, and template options in full.
Spend the majority of your time on the hero project and its README. Secondary projects can be lighter; what matters is that they are complete, linked, and readable. Visual polish on a project that has no clear business outcome will not move a recruiter.
What should you fix before sending your portfolio to recruiters?
Run through this checklist before you share any link. A broken GitHub link or a missing business outcome costs you an interview that your analysis would have earned.
Pre-submit checklist:
- All GitHub links open and load within three seconds
- Portfolio renders correctly on a phone (test in Chrome DevTools)
- Every project page has a one-sentence executive summary at the top
- Resume PDF downloads correctly from the nav link
- Contact email or form is visible without scrolling
- No project page ends without a recommendation or conclusion
- Tech stack (SQL, Python, Tableau, etc.) is listed on each project page
Common red flags that cost interviews:
- Broken or private GitHub repo links
- Raw Jupyter notebooks with no README and no narrative
- Dense paragraphs with no visuals or callout boxes
- Projects that describe the method but never state the business outcome
- Inconsistent fonts, colors, or layouts across pages
- Slow load times (over three seconds on mobile)
The fastest QA test: ask a non-technical friend to spend two minutes on your portfolio and then answer “What does this person do, and what did they find?” If they cannot answer both questions, your executive summaries need work before you send the link anywhere.
Pro Tip: Check your portfolio on a Windows laptop in Chrome, not just on your own machine. Font rendering and layout spacing can look very different across operating systems.
A fill-in-the-blanks project page template you can use today
Copy this skeleton into your portfolio builder or a Markdown file and fill in each bracketed field. It follows the end-to-end structure that job-ready portfolios use and surfaces the signals technical reviewers look for.
A project page is not a report — it is a conversation with a hiring manager who has 45 seconds. Every section should answer one question they would actually ask: What was the problem? What did you find? What should the business do next?
Project page template:
- Project title + one-line summary: — [What you did, in a single sentence]
- Executive summary: — [2–3 sentences a hiring manager can read in 45 seconds — what you found and why it matters]
- Problem / business question: — [The decision this analysis was meant to inform]
- Data: — [Source, size, time range, licensing, synthetic vs. real]
- Method / approach: — [Tools and techniques — SQL, Python, modeling, dashboards]
- Analysis & key visualizations: — [The 1–2 charts that carry the story, with captions]
- Findings: — [The answer, quantified]
- Business recommendation / next steps: — [What the business should do next]
- Tech stack + reproduction steps: — [Stack list and a link to the README]
- Appendices / full notebook: — [GitHub link]
README skeleton (paste into your repo’s README.md):
## [Project Name]
**Goal:** [One sentence]
**Stack:** [e.g., Python 3.11, Pandas, Seaborn, SQL (PostgreSQL)]
**Reproduce:**
  1. pip install -r requirements.txt
  2. Run notebooks/01_analysis.ipynb
**Files:** data/ | notebooks/ | outputs/ | requirements.txt
**Data notes:** [Source, license, synthetic/real, privacy handling]
**Contributors:** [Your name + any collaborators]
Example SQL snippet (cohort retention):
WITH cohort AS (
  SELECT user_id,
         DATE_TRUNC('month', first_purchase_date) AS cohort_month
  FROM users
),
activity AS (
  SELECT user_id,
         DATE_TRUNC('month', event_date) AS activity_month
  FROM events
)
SELECT c.cohort_month,
       DATEDIFF('month', c.cohort_month, a.activity_month) AS months_since_start,
       COUNT(DISTINCT a.user_id) AS active_users
FROM cohort c
LEFT JOIN activity a USING (user_id)
GROUP BY 1, 2
ORDER BY 1, 2;
Pro Tip: Use a reproducible random seed (random_state=42 in scikit-learn, set.seed(42) in R) in every model or sampling step. It takes five seconds and lets any reviewer reproduce your exact output.
Key Takeaways
A hire-ready data analyst portfolio requires a small set of curated end-to-end projects, each including a business outcome, reproducible code on GitHub, and at least one clear visualization.
| Point | Details |
|---|---|
| Curate, don’t dump | Three to five focused projects with clear outcomes outperform a long list of assignments. |
| Business outcome first | Every project page must open with a one-line result tied to a stakeholder question. |
| GitHub is non-negotiable | Each project needs a README, a requirements file, and a working repo link before you share. |
| Publish in 72 hours | Pick one existing project, write the case study, and go live before you perfect anything. |
| Myseera accelerates publishing | Upload your CV to Myseera and get a live, template-ready portfolio in minutes, then add GitHub links and a custom domain. |
Why curated, outcome-focused projects beat code dumps every time
The conventional advice for early-career analysts is to “show your work.” That instinct is right, but the execution is usually wrong. Showing your work does not mean sharing every notebook, every failed query, or every exploratory chart you produced along the way. It means showing that you can take a messy business question, work through it systematically, and land on a recommendation someone could actually act on.
Recruiters who review analyst portfolios are not grading your code style. They are asking: does this person understand what analysis is for? A portfolio that leads with a business outcome and then reveals the technical depth underneath answers that question immediately. A raw notebook that starts with import pandas as pd and ends with an unexplained scatter plot does not.
The “messy, real-world data” point matters more than most early-career analysts realize. A project built on a pre-cleaned Kaggle dataset tells a reviewer you can follow a tutorial. A project built on CMS Medicare claims data, NYC transit logs, or a scraped job board tells them you can handle the actual conditions of the job. Document your cleaning decisions, label your tradeoffs, and the messiness becomes an asset.
Finally, treat your portfolio as a living document. Track views and contact clicks with built-in analytics (Myseera’s Pro plan includes this), note which projects generate recruiter responses, and iterate. The analysts who get hired fastest are not the ones with the most polished portfolios on day one. They are the ones who publish quickly, gather signal, and improve.
Your fastest path from CV to live data analyst portfolio
Myseera is built for exactly the situation you are in: you have the skills and the projects, but turning them into a professional online presence takes time you would rather spend on analysis. Upload your CV in PDF or DOCX format, and Myseera’s AI extracts your experiences, skills, and projects automatically, then generates a portfolio with templates designed for case-study-heavy roles like data analytics.
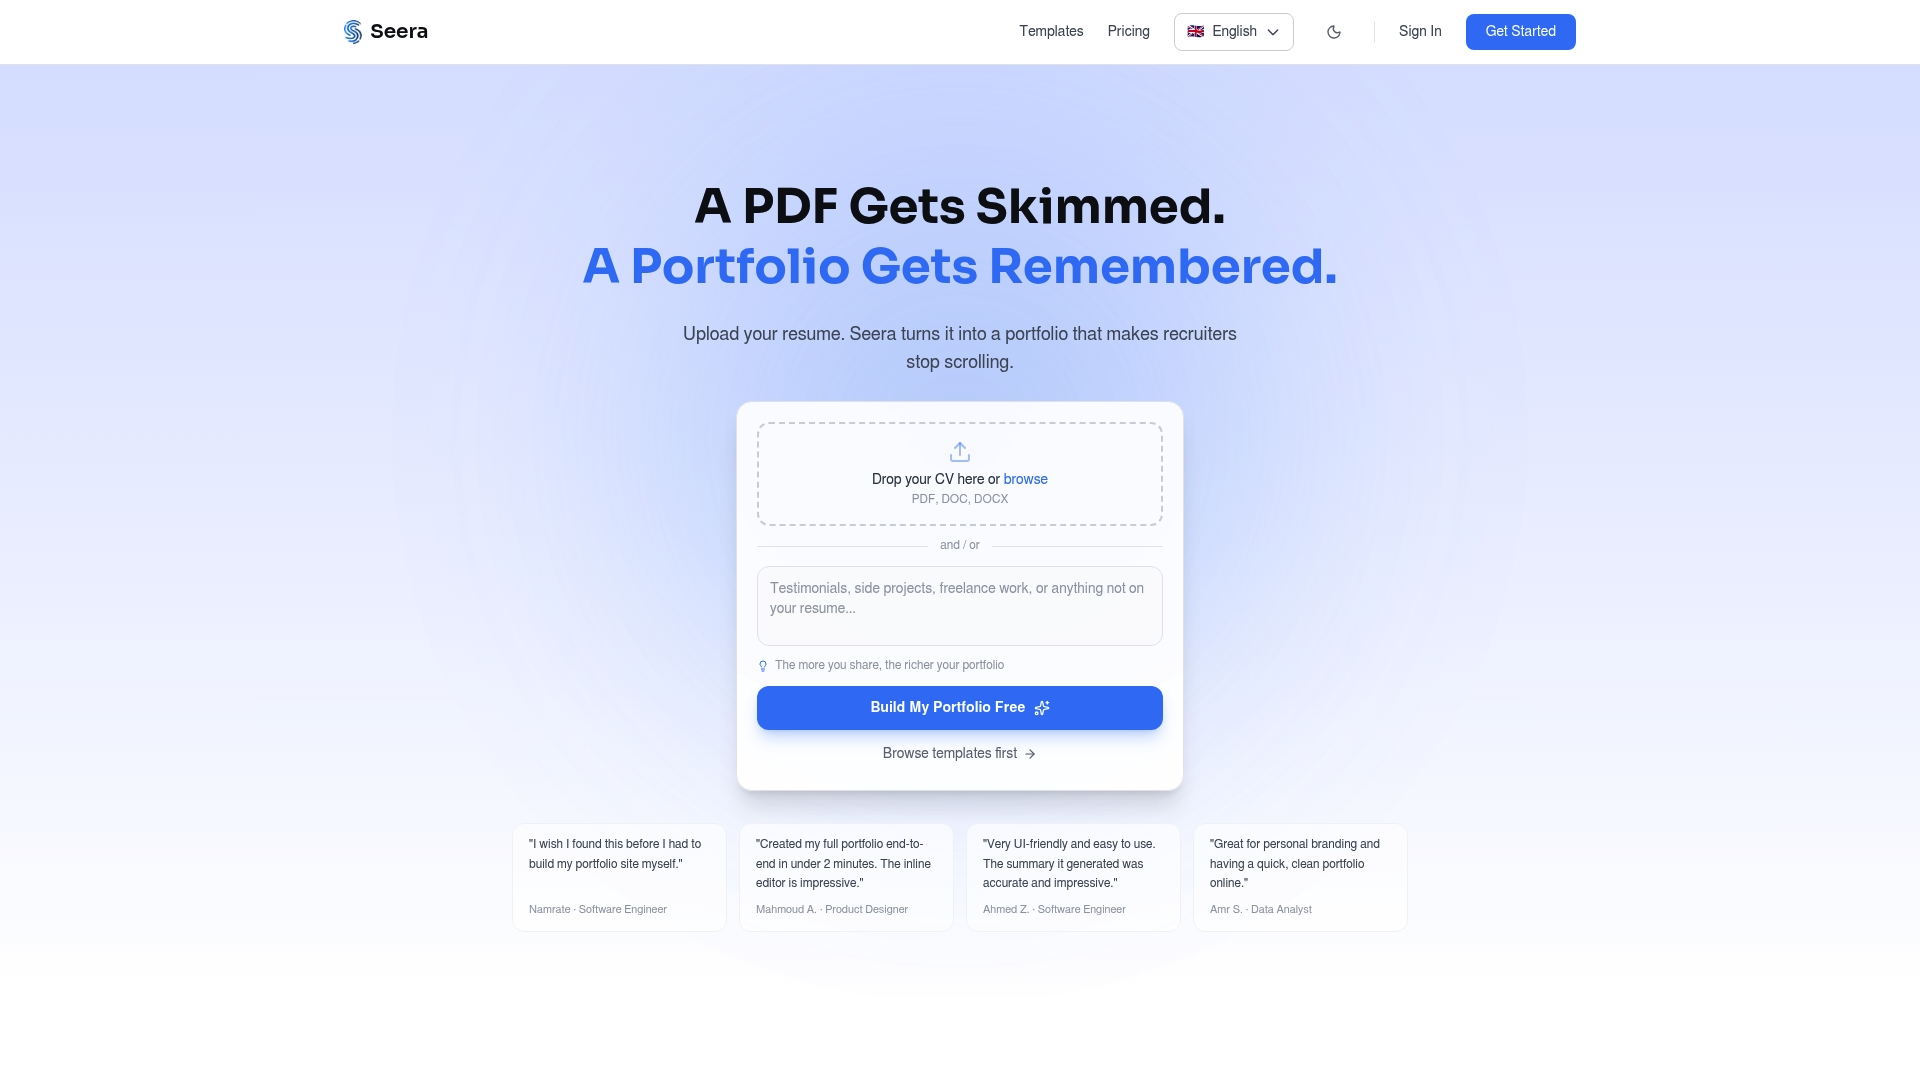
From there, you add your GitHub links inline, adjust the project descriptions with the built-in editor, and publish live. The free plan gets you a working portfolio today. The Pro plan adds a custom domain, built-in analytics so you can track recruiter visits, and access to all premium templates. For students and early-career analysts, the student portfolio builder is the fastest starting point.
Myseera is the site’s own product and a recommended option for readers who want the shortest path from resume to live portfolio. Convert your CV now and have a published URL to share within the hour.
Useful sources and further reading
| Resource | What it covers |
|---|---|
| How to Build a Data Analyst Portfolio — Coursera | Structured overview of portfolio components and career positioning; start here for a broad framework |
| 9 of the Best Data Analytics Portfolios on the Web — CareerFoundry | Real portfolio walkthroughs with commentary on what works; useful for benchmarking your own structure |
| JamieChristian22 Data Analyst Portfolio — GitHub | Open-source portfolio repo with README conventions and project structure you can fork and adapt |
| GitHub topic: data-analyst-portfolio | Browse dozens of public analyst portfolio repos to study README conventions, project-page layout, and load performance |
| Myseera Blog — Portfolio Tips & Guides | Ongoing guides on converting resumes to portfolio sites, template choices, and portfolio maintenance |
Use these as inspiration and structure references, not as templates to copy verbatim. When borrowing a project idea, use public or synthetic data and credit the original source in your README.
Recommended
- Best Portfolio Builders for Freelancers in 2026
- Best Portfolio Builders with Built-In Analytics in 2026 — Seera
- How to Make Your Portfolio Stand Out to Recruiters — Seera
- 7 Best Portfolio Website Builders for Developers 2026 (Free + Paid)